Dashboard: General Definition:
A dashboard is a visual display of the most important information needed to achieve one or more objectives; consolidated and arranged on a single screen so the information can be monitored.
In Tableau, We use Tableau to place multiple Reports at single place as well as to the define relationship from report to others.
Creating Simple Dashboard:
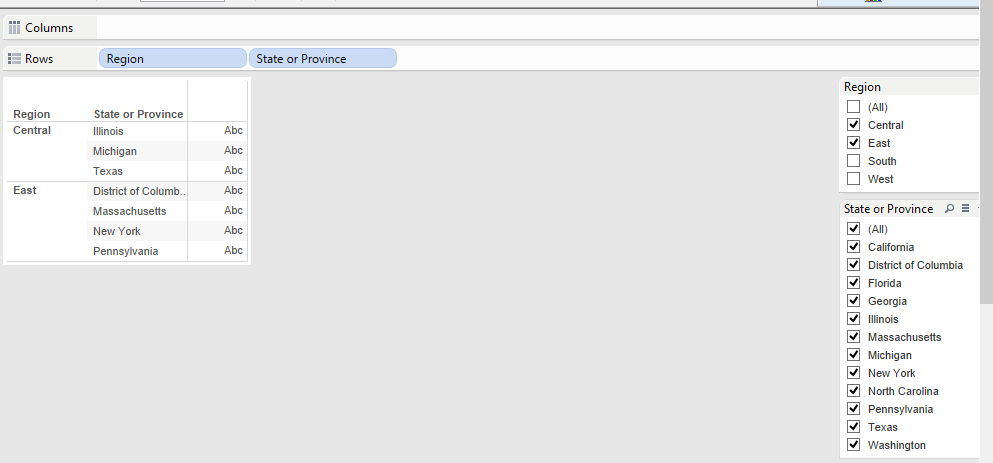
1) Create a Report with Region, Sales fields and Name it as "Region Sales"
2) Create another Report with State, Sales Fields and Name it as "State Sales"
3) Create a Dashboard by click on Dashboard menu, then click on "Create New Dashboard"
4) Then Drag the "Region Sales", "State Sales" report into Dashboard.
5) Now Dashboard have 2 Reports.
Objects in Dashboard:
1) Horizontal: it is used to place the organize the reports horizontally.
2) Vertical: it is used to place the organize the reports Vertically.
3) Image: We can add Image to the Dashboard.
EX: Drag the Image object to the work Area, then provide the path of the Image.
4) Webpage: It is used to add the Webpage to Dashboard.
EX: Drag the Webpage object to the work Area, then provide the URL.
5) Blank: It is used to keep space between two Reports on the Dashboard.
6) Text: It is used to add the textual data to the Dashboard.
Action :
Actions, which are used to define the interaction between reports.
Actions are used to define the Drill down in Dashboards.
Action Types:
1) Filter: Action Filters are used to define the Filter from 1 report to another, it means which ever we use in one report that related data will only show in other report.
EX:
1) Create a Report with Region, Sales fields and Name it as "Region Sales"
2) Create another Report with State, Sales Fields and Name it as "State Sales"
3) Create a Dashboard by click on Dashboard menu, then click on "Create New Dashboard"
4) Then Drag the "Region Sales", "State Sales" report into Dashboard.
5) Now Dashboard have 2 Reports.
6) Click on "Dashboard" file menu then click on "Action" , then on "Filter"
7) Select "Region Sales" as Source Sheet, "State Sales" as Target Sheet.
8) Select Run on as "Select"
9) Click on "OK".
10) Click on any of the Region in "Region Sales" report, then we can see selected Region related Data in the
"State Sales".
3) Highlight:
Highlight option is used to highlight the selected data related on other report.
EX: 1) Create a Report with Region, Sales fields and Name it as "Region Sales"
2) Create another Report with State, Sales Fields and Name it as "State Sales"
3) Create a Dashboard by click on Dashboard menu, then click on "Create New Dashboard"
4) Then Drag the "Region Sales", "State Sales" report into Dashboard.
5) Now Dashboard have 2 Reports.
6) Click on "Dashboard" file menu then click on "Action" then click on "Highlight"
7) Select "Region Sales" as Source Sheet, "State Sales" as Target Sheet.
8) Select Run on as "Select".
9) Click on "OK".
10) Click on any of the Region in "Region Sales" report, then we can see selected Region related Data in the
"State Sales" will be highlighted.
3) URL:
We use this kind of Actions to navigate from Report to any specific webpage.
1) Create a Report with Region, Sales fields and Name it as "Region Sales".
2) Click on "Dashboard" file menu then click on "Action" then click on "URL".
3) Then Define "https://www.google.co.in/" in the URL, click on "OK".
4) click on any of the region in the report, it will take to the google page.
========================
Run Action On:
We use "Run Action On" to define the User interaction with report. After define the Action type, we define Run Action On.
Run Action Types:
1) Hover: We use this type to define the interaction from 1 report to another, in this approach action will be applied by keeping mouse hover on the Source Report.
2) Select: We use this type to define the interaction from 1 report to another, in this approach action will be applied when select (Click) any data in the Source Report.
3) Menu: We use this type to define the interaction from 1 report to another, in this approach action will be applied when click on data then click on menu bar in the Source Report.
Creating Dashboards:
Navigating with in the Same Dashboard
1) Create a Report with Region, Sales fields and Name it as "Region Sales"
2) Create another Report with State, Sales Fields and Name it as "State Sales"
3) Create a Dashboard by click on Dashboard on menu bar, then click on "Create New Dashboard", Right click on Dashboard at footer level then Rename as " Region, State Sales Dashboard".
4) Then Drag the "Region Sales", "State Sales" report into Dashboard.
5) Now Dashboard have 2 Reports.
6) Click on "Dashboard" menu bar then click on "Action" , then on "Filter"
7) Select "Region Sales" as Source Sheet, "State Sales" as Target Sheet.
8) Select Run on as "Select"
9) Click on "OK".
10) Click on any of the Region in "Region Sales" report, then we can see selected Region related Data in the
"State Sales".
Navigating from one Dashboard to another.
1) Create a Report with Region, Sales fields and Name it as "Region Sales"
2) Create another Report with State, Sales Fields and Name it as "State Sales"
3) Create a Dashboard by click on Dashboard on menu bar, then click on "Create New Dashboard", Right click on Dashboard at footer level then Rename as " Region Sales Dashboard". Then Drag "Region Sales" report into work area.
4) Create a Dashboard by click on Dashboard on menu bar, then click on "Create New Dashboard", Right click on Dashboard at footer level then Rename as " State Sales Dashboard". Then Drag "State Sales" report into work area.
5) Now there are 2 Dashboards .
6) Go to "Region Sales Dashboard" menu bar then click on "Action" , then on "Filter"
7) Select "Region Sales" as Source Sheet from Region Sales Dashboard, "State Sales" as Target Sheet from .State Sales Dashboard.
8) Select Run on as "Select"
9) Click on "OK".
10) Click on any of the Region in "Region Sales" report, then we can see selected Region related Data in the
"State Sales".
Note:
1) We can define the Size of the view in the Dashboard by selecting the Sizes which are located in Left bottom side.
2) When we drag the Reports into Dashboard, it occupies total space of the Dashboard, if you want to define the size then select "Float" option then we can define the Size of the Report in the Dashboard.
Float: it is used move report from 1 place to another place within the Dashboard and can define the custom size.
Tiled: It is fixed size, occupies maximum size in the Dashboard, If we place 2 reports in Dashboard, that 2 reports occupies total space of the Dashboard.
3) Text Object: We use if only for add the comments or to show any textual data along with Report in the Dashboard.